
South African retirees are paying a premium for active management. The numbers suggest they shouldn’t have to.
I recently ran a detailed comparison of what a R1.2 million living annuity portfolio would have looked like over the past three years — managed by top-tier active balanced funds versus a simple basket of low-cost passive ETFs listed on the JSE.
The result stopped me cold.
The Starting Point
Living annuity investors typically end up in one of South Africa’s well-known active balanced funds. These are credible, professionally managed products with long track records. The fees are roughly 1.4–1.5% per year, all-in. That sounds reasonable. On R1.2 million, it’s about R17,000 a year.
Compare that to a passive ETF blend — a mix of a global equity ETF, a local equity ETF, an inflation-linked bond ETF, and a money market buffer. The blended cost? Around 0.25% per year. On R1.2 million, that’s roughly R3,000 annually.
| Portfolio type | Annual TER | Fee on R1.2m / year |
| Active balanced fund (typical) | ~1.44% | ~R17,280 |
| Passive ETF blend | ~0.25% | ~R3,000 |
| Annual saving | ~1.19% | ~R14,280 |
The fee difference is R14,000 per year. Compounded over three years, that’s approximately R47,000 sitting in your pocket instead of a fund manager’s pocket. But fees are only half the story.
What the Returns Actually Showed
Taking the period from January 2022 to December 2025 — which included a brutal 2022 for equity markets, a strong 2023 recovery, and a powerful 2024–2025 bull run — here is what happened to R1.2 million with a 7% annual drawdown of R84,000 per year:
| Portfolio | 2022 | 2023 | 2024 | 2025 |
| Company 1 — active balanced | −1.5% | +15.5% | +15.6% | +20.0% |
| Company 2 — active balanced | +4.5% | +13.0% | +16.5% | +22.0% |
| Core passive ETF blend | +3.5% | +19.0% | +20.0% | +22.5% |
| Enhanced passive + tech sleeve | −7.0% | +24.5% | +25.5% | +23.5% |
* Enhanced blend holds 12% in a rand-denominated S&P 500 IT sector ETF (JSE-listed, Regulation 28 compliant). The 2022 drag reflects the global tech selloff; recovery in 2023–2025 was substantial.
Portfolio value after 3 years (after all drawdowns)
| Portfolio | End value | Net gain |
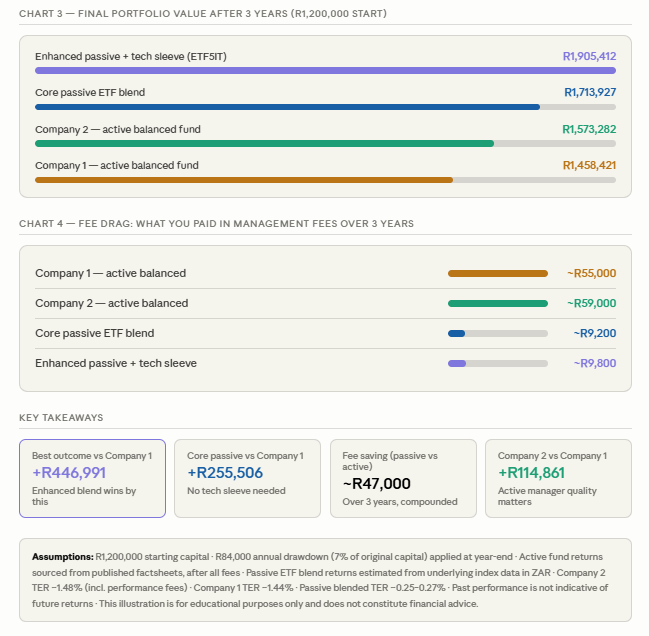
| Company 1 — active balanced fund | R1,458,421 | +R258,421 |
| Company 2 — active balanced fund | R1,573,282 | +R373,282 |
| Core passive ETF blend | R1,713,927 | +R513,927 |
| Enhanced passive + tech sleeve (12% S&P 500 IT ETF) | R1,905,412 | +R705,412 |
All figures are after annual drawdowns. All are after fees.
Why This Happens
It is not because active managers are incompetent. Many are genuinely skilled. The problem is structural.
- Fees compound against you. A 1.2% annual fee drag does not feel significant in year one. Over ten years on a growing portfolio it becomes enormous. Every rand paid in fees is a rand that is not compounding.
- Most active balanced funds cannot consistently beat their benchmark net of fees over rolling five-year periods. The data globally — and increasingly locally — supports this. Some years they do. Some years they do not. The fee is guaranteed every year regardless of outcome.
- Passive ETFs have become genuinely good. The JSE now offers low-cost, Regulation 28-compliant ETFs covering global developed markets, SA equity, inflation-linked bonds, and sector-specific exposures like global technology. The building blocks exist to construct a properly diversified, income-generating living annuity portfolio without paying for active management.
The Living Annuity Context Matters
This is not an argument for reckless risk-taking in retirement. A living annuity requires careful construction because you cannot stop drawing income when markets fall. Sequence-of-returns risk is real.
The key is structure, not just product selection:
- Hold one year’s drawdown in money market at all times. Never sell growth assets to fund income in a downturn.
- Keep meaningful inflation-linked bond exposure — around 10% — to protect real purchasing power.
- Keep a global equity anchor. Offshore exposure is your rand hedge and your long-term growth engine.
- Use sector tilts carefully. A 10–12% position in a diversified technology ETF adds upside without the blowup risk of individual stock selection.
A 7% annual drawdown is sustainable if your portfolio compounds at 12%+ over time. Paying 1.4% in fees makes that harder to achieve than it needs to be.
The Question Worth Asking
If your living annuity has been sitting in an active balanced fund for five or more years, pull your actual statements. Calculate what you paid in fees. Compare your return to the JSE All Share and MSCI World over the same period — both are freely available online.
You may find the active manager added value. Some do. But you deserve to know the number, not just trust the brand.
The best investment decision you can make in retirement is often not which stocks to pick — it is how much of your return you keep.
Fee impact summary on R1,200,000 over 3 years
| Portfolio | TER (all-in) | Total fees paid (3yr) | Fee saving vs active |
| Company 1 — active balanced | ~1.44% | ~R55,000 | — |
| Company 2 — active balanced | ~1.48% | ~R59,000 | — |
| Core passive ETF blend | ~0.25% | ~R9,200 | ~R47,000 |
| Enhanced passive + tech sleeve | ~0.27% | ~R9,800 | ~R49,000 |
Disclaimer: This article reflects personal research and opinion. It is not financial advice. Active fund returns are sourced from published factsheets after all fees. Passive ETF blend returns are weighted estimates based on underlying index data in ZAR — these are approximations, not audited fund data. Drawdown of R84,000/year (7% of original R1.2m capital) applied at year-end. Past performance is not indicative of future results. Consult a qualified financial adviser before making changes to your retirement portfolio.
The Fee You Don’t See Is the Return You Don’t Get
The Fee You Don’t See Is the Return You Don’t Get: Living annuities actively managed by institutions