
CAPITAL SEASONS
WEEKLY MARKET COMMENTARY
Week ending 3 April 2026
Global Context Overview
Markets closed the week on a more constructive note. The S&P 500 (SPY — tracks the 500 largest US companies) recovered 3.4% to close at $655.83, and the Nasdaq 100 (QQQ — tracks the 100 largest technology-heavy US companies) added 4.0% to end at $584.98. The Dow Jones (DIA — tracks 30 major US blue-chip companies) gained 3.0% to $465.06 and the Russell 2000 (IWM — tracks 2,000 smaller US companies) recovered 3.4% to $251.29. These are meaningful bounces — but the context matters. All four indexes remain below their 50-day moving averages, and SPY and QQQ are still below their 200-day SMAs. One positive week does not change a season.
The most encouraging data point of the week was the VIX (CBOE Volatility Index — measures expected market fear and uncertainty; higher = more fear). Volatility dropped sharply from 31.05 to 23.87 — a decline of 7.2 points. Fear is receding, but at 23.87 it remains elevated. A sustained move below 20 would be a materially different signal. Until then, the market’s nervous system is still on alert.
Gold (GLD — SPDR Gold Shares ETF) continued its strong year, gaining another 3.5% to $429.41 — now 49% above its level one year ago. The hard asset bid remains firmly intact. The US Dollar (UUP — Invesco DB US Dollar Index Bullish Fund) held steady near $27.86, marginally above its 200-day SMA. The rand moved to R16.95/$ from R17.12/$ the previous week — a marginal rand recovery, though it remains structurally soft against the dollar.
South Africa
The JSE All Share Index (JSEJF — the broad South African stock market index, tracking all companies listed on the Johannesburg Stock Exchange) ended unchanged at 9.43 this week. For South African investors, the most relevant local development was the SARB’s decision at its 26 March MPC meeting to hold the repo rate steady at 6.75% — a second consecutive pause — citing upside risks to the inflation outlook linked to the ongoing Middle East conflict. Governor Kganyago noted that while headline inflation matched the 3% target in February, higher energy prices are expected to push the print toward 4% in the second quarter, driven largely by fuel inflation exceeding 18%.
This is a meaningful shift in tone. The SARB’s quarterly projection model now signals only one rate cut in 2026, down from two previously projected. For SA investors, this means the rate relief cycle is effectively on hold. Prime lending rate stays at 10.25%, and household debt relief from further cuts will be delayed until the global oil and geopolitical picture clears.
The rand remains under pressure structurally, sitting 5.1% weaker on a one-month basis despite this week’s partial recovery. For SA investors holding US-listed positions, rand weakness continues to act as a performance amplifier — both a risk and an opportunity depending on portfolio positioning.
United States
The Federal Reserve remains on hold. Chair Powell has been clear: the Fed will not cut until it sees meaningful progress on inflation, and the combination of tariff-driven price pressures and geopolitical energy shocks has made that progress harder to achieve. The FOMC projects one rate cut in 2026, but Wall Street is now less confident even that single cut will materialise this year.
The tariff picture continues to evolve. Following the Supreme Court’s early 2026 ruling that struck down the IEEPA emergency tariffs, the administration replaced them with Section 122 and Section 232 measures. The current average effective tariff rate stands near 12%, the highest level since the 1940s. JPMorgan economists note that tariff costs — largely absorbed by businesses in 2025 — are now being passed to consumers in 2026, adding meaningful pressure to household budgets. The average annual tariff burden per US household is estimated at around $1,500 this year.
Earnings estimates are being revised lower across consumer-facing and import-dependent sectors. The labour market remains resilient but job growth is slowing. This is a stagflationary undertow — not a crisis, but a meaningful constraint on the Fed’s ability to ease even as growth softens. Investors who are watching for the DiLiddo signals — earnings, inflation, interest rates — should note that all three remain under pressure. That is the definition of a bear market environment.
Global Markets
European markets have shown relative resilience, supported by domestic demand and some shield from US tariff exposure. However, energy price pressures from the Middle East conflict are a shared burden, and export-oriented sectors face headwinds from softer US growth.
China’s domestic stimulus measures continue to provide a floor for commodity demand, particularly copper, lithium, and rare earth elements — sectors which our data shows are recovering from sharp pullbacks while maintaining strong 1-year performance. The copper mining complex (COPX — Global X Copper Miners ETF; COPP — Sprott Copper Miners ETF; COPJ — Global X Junior Copper Miners ETF) is stabilising above its 200-day SMA after a difficult month, consistent with ongoing Chinese infrastructure investment providing underlying demand support.
Emerging markets broadly face a difficult combination: a strong dollar, elevated commodity prices (net positive for exporters, negative for importers), and capital flow sensitivity to US rate expectations. South Africa sits in the commodity-exporting camp — a structural advantage in a hard-asset market season.
Summary: Earnings, Inflation & Interest Rates
| Region | Earnings | Inflation | Interest Rates |
| South Africa | Stabilising | Under pressure | On hold — hawkish |
| United States | Slowing | Under pressure | On hold — cautious |
| Global | Mixed | Elevated | Diverging |
Guidance for Investors
Dr DiLiddo’s framework is unambiguous: when earnings are slowing, inflation is elevated, and rates are on hold with a hawkish bias, the market season is Winter. This week’s bounce is constructive, but it does not change the season. Here is what disciplined investors should be doing right now:
- Remain patient with your watchlist. Attractive valuations are not the trigger — a seasonal confirmation is. Prices that look cheap in Winter can look cheaper still by the time Spring arrives.
- Energy and hard asset positions continue to lead. XLE (Energy Select Sector SPDR — broad US energy), GDX (VanEck Gold Miners ETF), SIL (Global X Silver Miners ETF), COPX (Global X Copper Miners ETF), and related names remain the strongest sector cluster in this environment. These are the stocks doing their seasonal job.
- Watch the VIX. A sustained close below 20 — not a single-day dip — is the first indicator that the market’s stress level is genuinely normalising. At 23.87 this week, we are heading in the right direction but are not there yet.
- Monitor SPY relative to its 50-day and 200-day SMAs. SPY at $655.83 is still -3.0% below the 50-day and -1.0% below the 200-day. Both need to be cleared and held before a seasonal shift can be confirmed.
- Biotech (SBIO — ALPS Medical Breakthroughs ETF; XBI — SPDR S&P Biotech ETF) and semiconductors (SMH — VanEck Semiconductor ETF; SOXX — iShares Semiconductor ETF) showed genuine internal improvement this week — the clearest week-on-week sprouts in the data. These are sectors to watch, not yet sectors to buy.
- For South African investors: the rand’s structural weakness is a real consideration for offshore allocations. Maintain appropriate currency exposure and do not let rand strength in any single week alter your longer-term offshore posture.
Capital Seasons Market Weather Map
This week’s Capital Seasons Market Weather Map registers Winter, with Defensive Conditions — easing and a Protect posture.
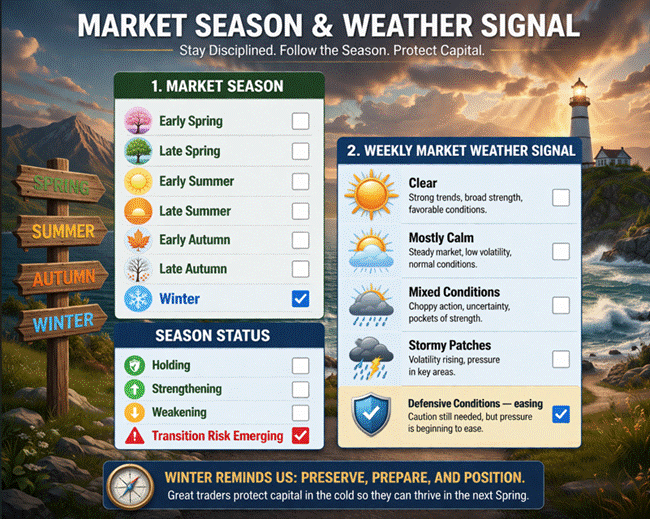
3. Market Climate Snapshot
Index performance improved meaningfully week-on-week — SPY +3.4%, QQQ +4.0%, IWM +3.4% — and the VIX dropped from 31.05 to 23.87. This is the most constructive weekly shift we have seen since the Winter signal solidified. However, every major US index remains below its 50-day SMA, and the two growth-oriented indexes (SPY and QQQ) are still below their 200-day SMAs. The bounce is a recovery within a downtrend, not a reversal of one.
Sector rotation this week produced notable signals. The clearest improvement came from biotech (SBIO — ALPS Medical Breakthroughs ETF — flipped from -6.2% to +5.1% on a 1-month basis), semiconductors (SMH — VanEck Semiconductor ETF — improved 4.4 percentage points on the 1-month figure), and communication services. Energy, which has been the Winter’s strongest sector cluster, gave back 8-10 percentage points on the 1-month figures — a natural consolidation given the sharp prior gains, but worth monitoring for follow-through.
Precious metal miners (GDX — VanEck Gold Miners ETF; SIL — Global X Silver Miners ETF; GDXJ — VanEck Junior Gold Miners ETF) are stabilising. Their 1-month figures are still negative — down 18-21% — but their 200-day SMA positioning improved materially, with most miners now sitting 20-24% above those long-run averages. The consolidation is holding structure. Gold itself recovered 3.5% and its 1-year return of 49% remains the dominant hard asset signal of this cycle.
The rand moved from R17.12/$ to R16.95/$ — a marginal improvement — but remains structurally soft. The SARB’s hawkish pivot at its March MPC meeting has reduced the likelihood of further rate relief in the near term, keeping financial conditions tighter for SA consumers.
4. What This Means for Investors
Focus on:
- Maintaining your Protect posture — Winter is not over, but the VIX improvement is the first meaningful signal to track.
- Monitoring energy sector consolidation — still leading, but momentum is fading. Watch whether XLE (Energy Select Sector SPDR ETF) holds above its 200-day SMA.
- Watching biotech and semiconductors — internal improvement is real. These are early-season growth sectors that may lead the Spring rotation when the time comes.
Be cautious with:
- Technology (XLK — Technology Select Sector SPDR ETF; VGT — Vanguard Information Technology ETF), communication services (XLC — Communication Services Select Sector SPDR ETF) — both remain below their 200-day SMAs despite this week’s improvement. Not safe yet.
- Real estate (XLRE — Real Estate Select Sector SPDR ETF; VNQ — Vanguard Real Estate ETF) — Quant ratings of 1.5-1.8 signal continued weakness. REITs (Real Estate Investment Trusts — companies that own income-producing properties) typically underperform in high-rate, high-inflation environments.
- Acting on watchlist positions before the Market Weather Map confirms a seasonal shift.
Avoid for now:
- Consumer discretionary (XLY — Consumer Discretionary Select Sector SPDR ETF — tracks companies selling non-essential goods and services) — below 200-day SMA, Quant of 1.7. Tariff-driven consumer pressure is not yet priced out.
- Financials (XLF — Financial Select Sector SPDR ETF — tracks banks, insurance companies and financial services) — down 10% over 3 months, below key moving averages. Rate uncertainty is a headwind.
5. Capital Seasons Guidance
Winter rewards patience. The investors who protect capital now are the ones who have the seeds ready to plant when Spring arrives. One good week does not mean the frost is gone — but the sun is starting to show. Watch the VIX, watch the 50-day SMA on SPY, and trust the system.
6. Mari’s Overlay
This week felt different. Not dramatically — but the VIX dropping from 31 to 24 in a single week is the kind of shift I pay attention to. That is not just noise reduction; that is the market exhaling. The sector data confirms what I am seeing: energy pulled back, which is normal after such strong gains, and meanwhile biotech and semis quietly improved. I am keeping my watchlist exactly where it is — B, ENVA, HRTG in Tier 1; MFC, PINE, CLS in Tier 2. No action yet. But I am watching more closely now. Two consecutive weeks of improvement in the VIX and SPY above its 50-day SMA would be my first real signal that something is changing. We are not there yet. But we are closer than we were last week.
Website Weather Commentary
For use on capitalseasons.co.za
The Capital Seasons Market Weather Map registers Winter this week, with Defensive Conditions that are beginning to ease. The VIX retreated from 31 to 24, and all four major US indexes posted positive weekly returns. However, SPY and QQQ remain below their 200-day moving averages, and the structural conditions that define a Winter market — slowing earnings, elevated inflation, and rates on hold — have not yet changed. Energy and hard asset sectors continue to lead. Biotech and semiconductors showed encouraging week-on-week improvement. Gold rose another 3.5% and remains 49% above its year-ago level. The rand moved to R16.95/$ from R17.12/$ — a marginal improvement — but remains soft against the dollar. The posture remains Protect. Watch for VIX below 20 and SPY above its 50-day SMA as the first indicators of a seasonal shift.
Capital Seasons | Invest with the seasons. Not the noise.
capitalseasons.co.zaCapital Seasons Market Weather Maps are educational tools designed to support investor awareness and disciplined decision-making. They describe market conditions and investor context. They are not predictions and do not constitute personal financial advice. Always
Strength returns, but the season remains winter